Below are two pictures of the same few seconds of a singer; switch between them, or show both at once. Wave is the waveform: how far the speaker cone is pushed in or out at every instant. Spectrum is a spectrogram: how much energy sits at each pitch, moment by moment, brighter where it's louder.
Only one of these two pictures could be turned back into exactly the sound you hear. Which one, and what is the other missing?
One voice, two pictures
ReplayThe spectrogram looks like it holds more. You can see the pitch, the vibrato, the harmonics, the hiss of every "s". Surely if you can see all that, you could play it back?
You can't, not exactly. And the reason is the key to how every audio model works.
What does a spectrogram leave out?
A spectrogram chops the sound into short slices and, for each slice, measures how strong every frequency is. That strength is the magnitude. But each of those frequencies also has a phase: where it is in its cycle at that moment, whether its wave is heading up or down. The usual spectrogram picture keeps the magnitudes and throws the phases away.
Phase sounds like a detail, and in a steady note it nearly is. In an attack it's everything. A drum hit is the moment when hundreds of frequencies all line up and push the speaker together. Keep their strengths but scramble their timing, and the hit melts into a smear.
So the waveform is the one that plays back exactly: it is the sound, sample by sample. The spectrogram is a summary. (A full analysis can keep the phases as well and rebuild the sound perfectly; the picture you usually see just doesn't.)
You've almost certainly heard what lost phase sounds like. In 2010 a Justin Bieber song slowed down 800% went viral: a pop track turned into a glowing, cathedral-sized wash. It was made with Paulstretch, a tool that keeps each slice's magnitudes and invents fresh phases on purpose. The attacks dissolve and everything turns to shimmer. That dreamy wash is what "the phase was thrown away" sounds like.
Four ways to see the same sound
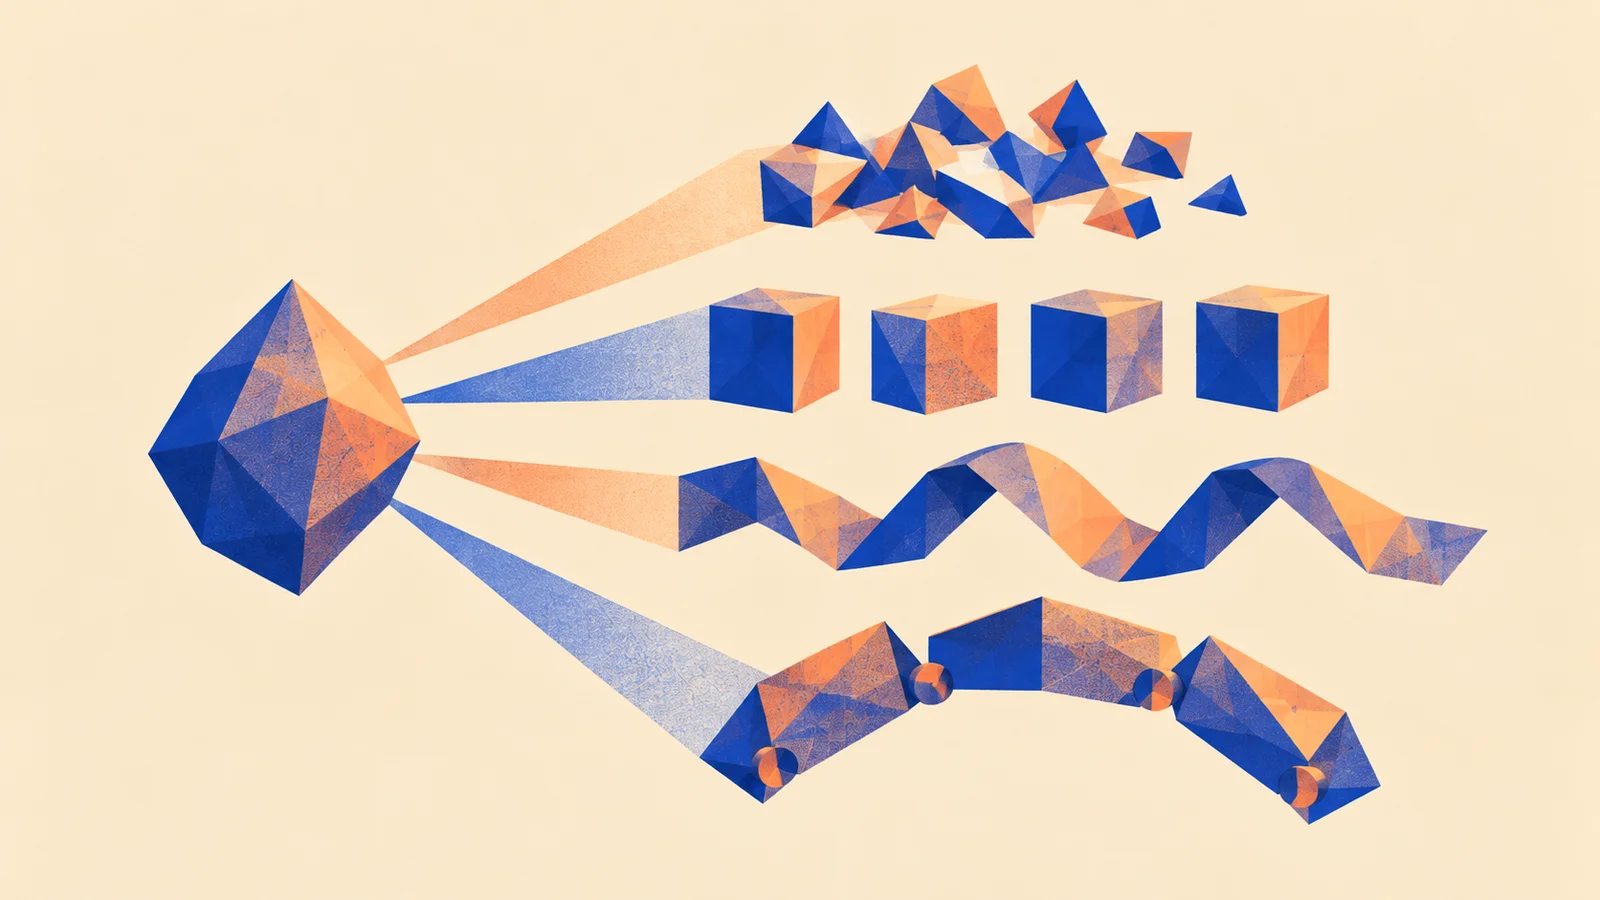
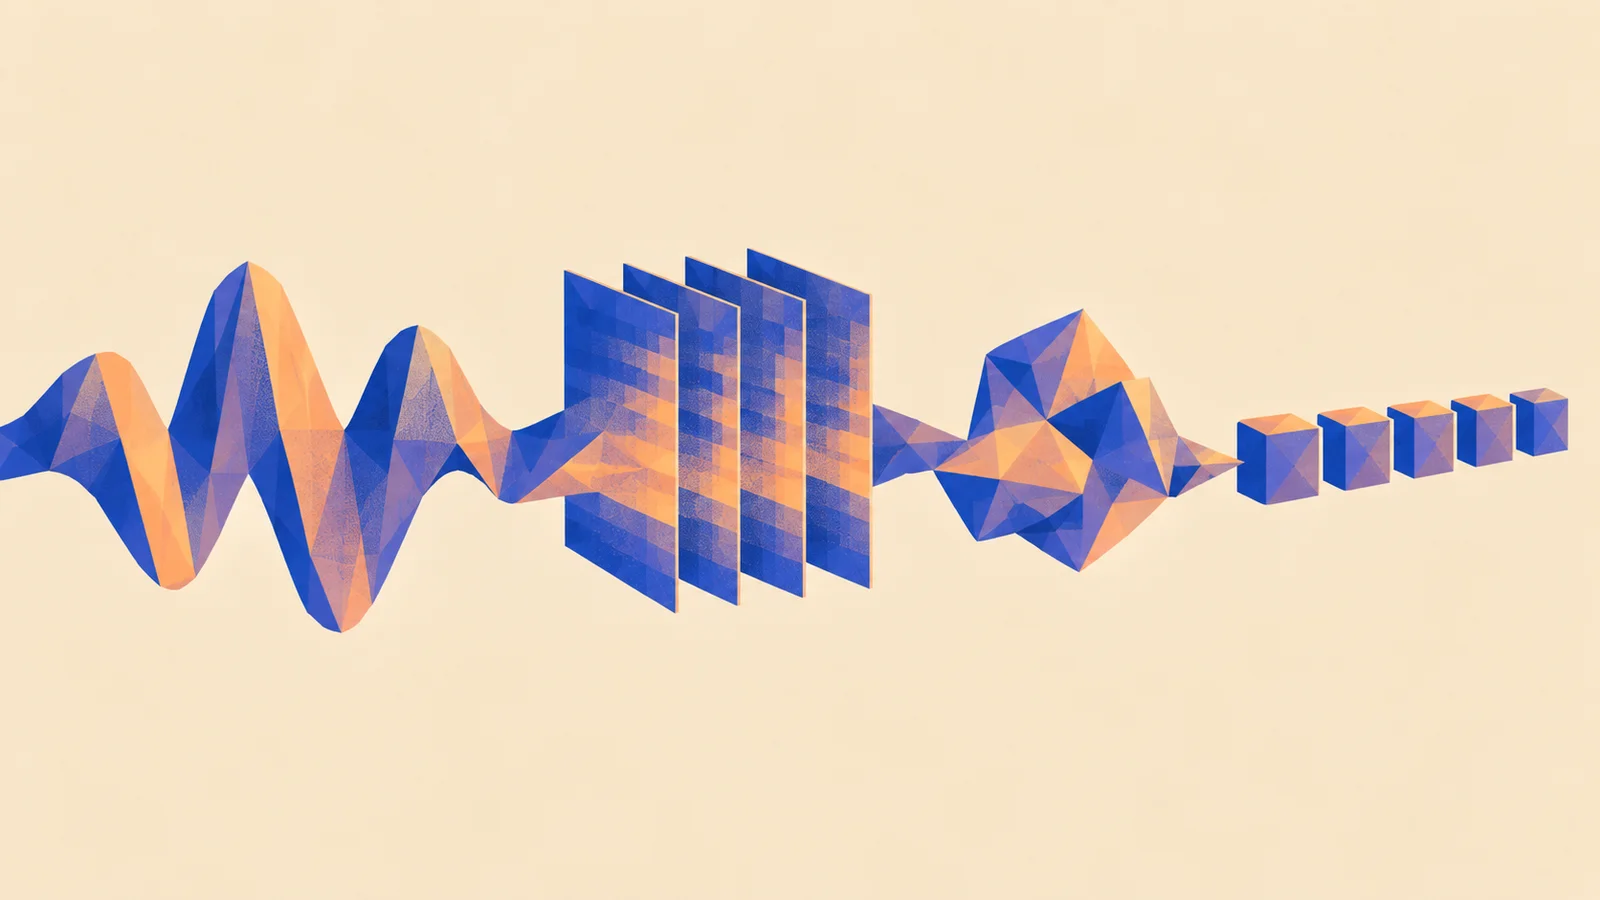
Here's the whole ladder of representations a model might use, from the full recording down to a handful of codes, and what each step costs.
From recording to code, and back
- Waveform. Every sample, tens of thousands per second. Nothing is lost, which is also the problem: it's a lot of numbers, and a pitch or a chord isn't obvious in it.
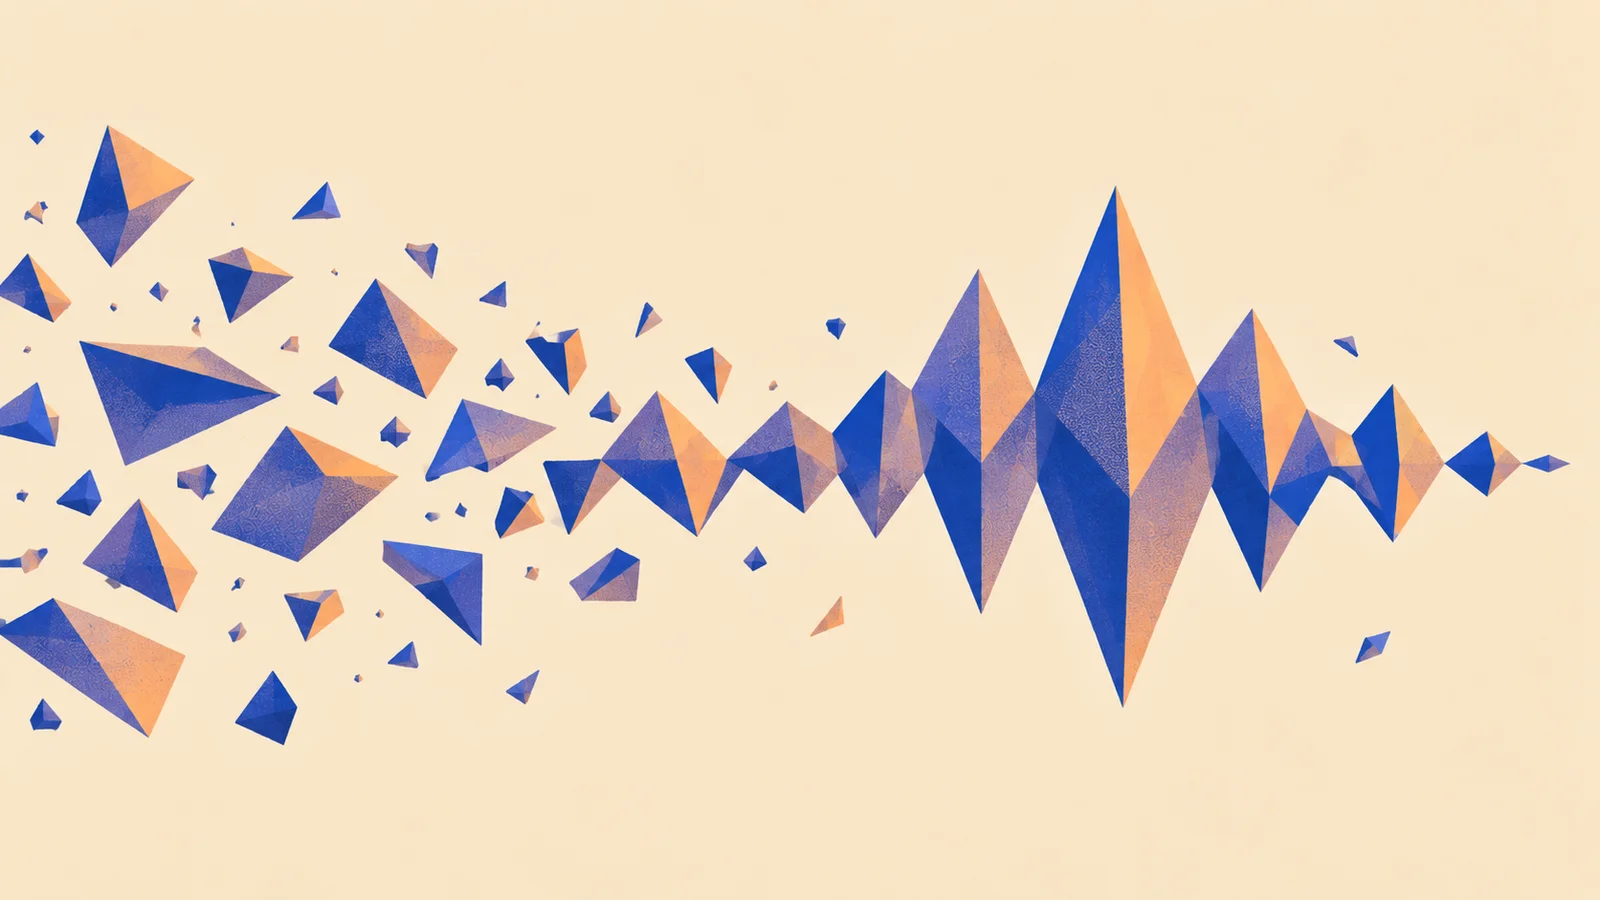
- Spectrogram. Pitches, harmonics and noise become shapes you can see. That's why many separation and transcription models work on one. The price is phase.
- Latent. A short list of numbers per moment, learned by a model (the encoder) during training. The numbers mean whatever helped that model rebuild sound. One might roughly follow brightness in one model and nothing nameable in another.
- Tokens. The latent rounded to the nearest entry in a fixed list of codes, like words from a dictionary. That's what lets language-style models write audio one code at a time. A token is not a note, and the third token is not the third beat.
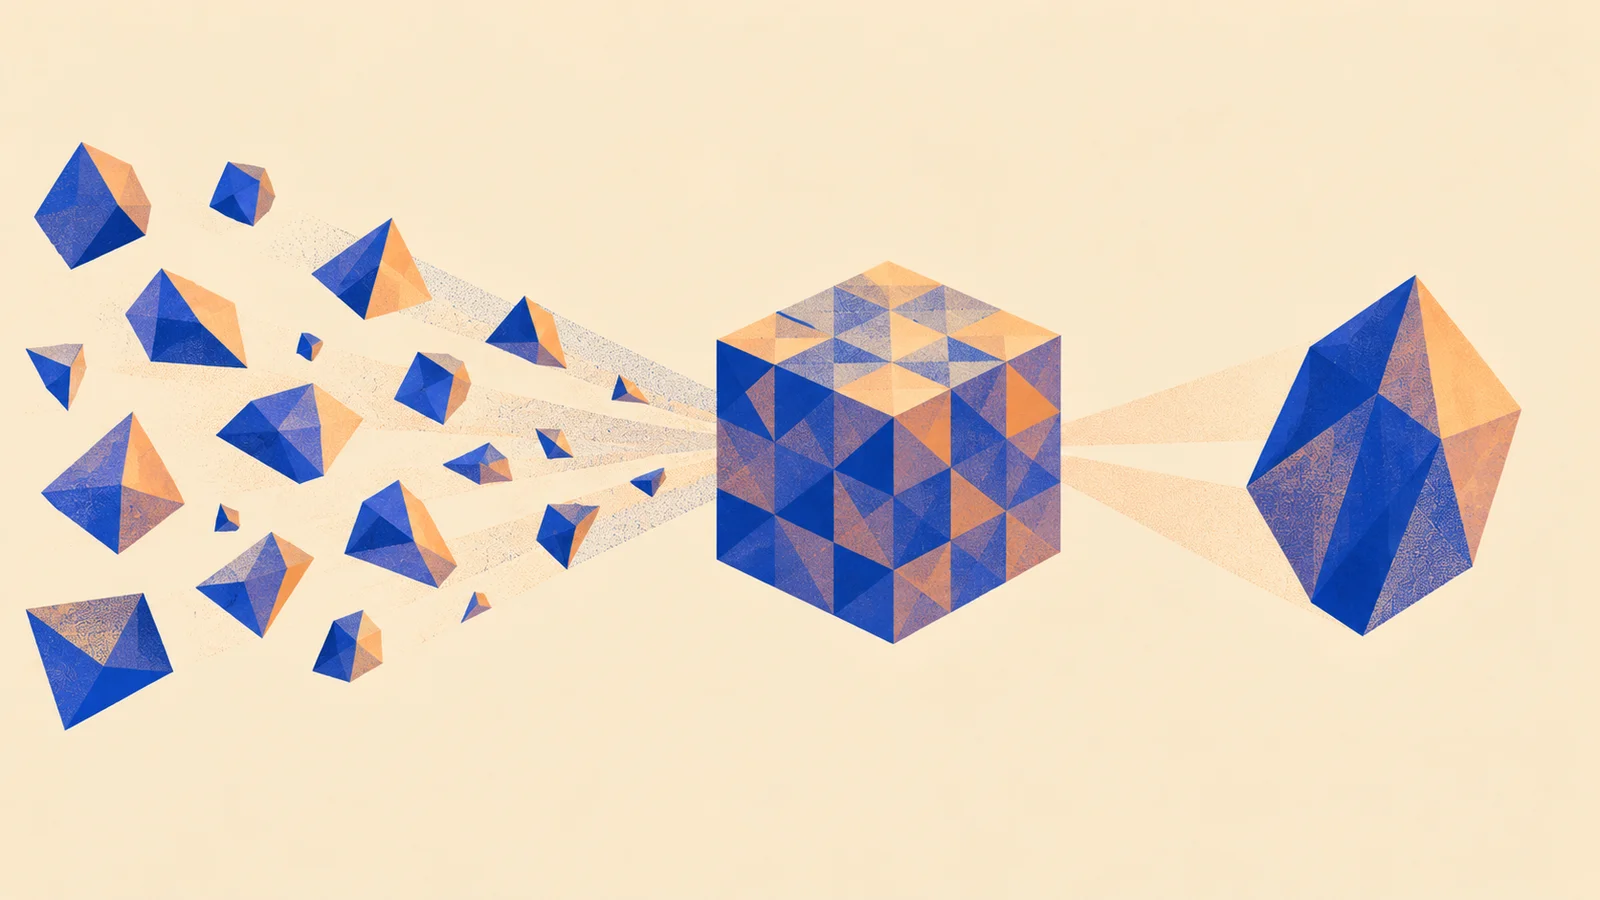
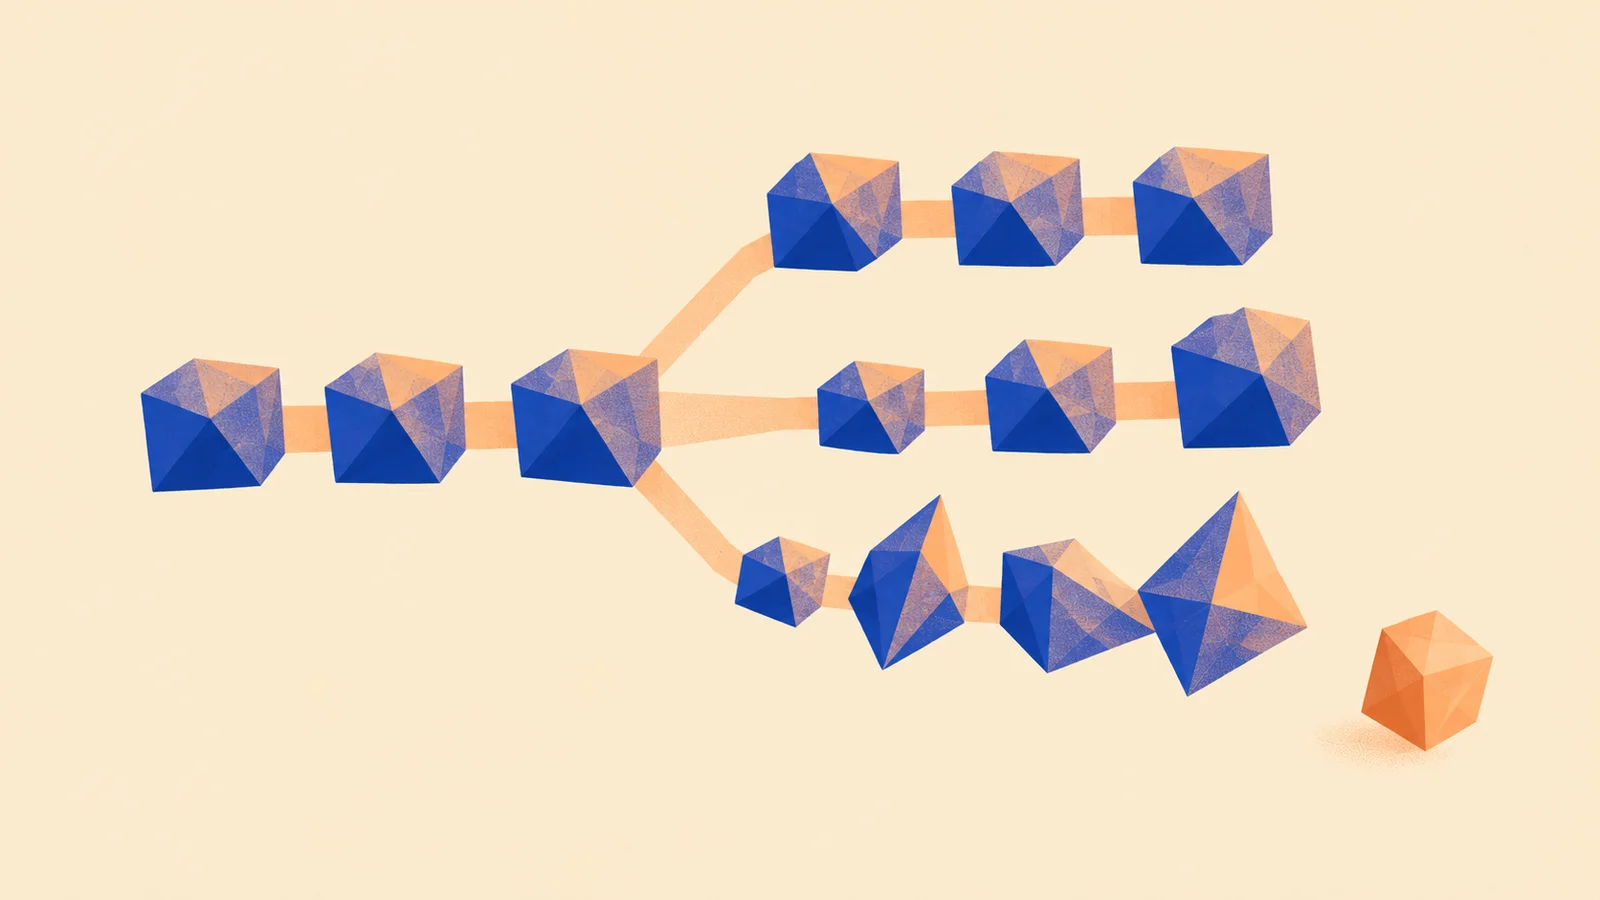
The tools that turn sound into tokens and back are called neural audio codecs. Each one has three parts: an encoder that turns a short slice of sound into a latent, a codebook (the fixed list of codes) to round it to, and a decoder that turns codes back into sound.
Many codecs stack several codebooks. The first picks a rough code for the slice; the next picks a correction for what the first got wrong; the next corrects that, and so on. Keep only the first few layers and you get a smaller, rougher sound; keep them all and you get more detail back. That's why a generator writing audio tokens is really writing several streams at once, a rough one and its refinements. Google's Magenta RealTime 2, for example, writes 12 codes from its SpectroStream codec for every 40 ms frame of stereo sound. Notes can be tokens too, but of a very different kind: a note token names a musical event you can change, as Generating notes shows.
Why is the pitch axis bent?
Your ear hears pitch by ratios: 100 to 200 Hz and 5,000 to 10,000 Hz both sound like one octave. A spectrogram with evenly spaced rows in hertz gives the bass a sliver of the picture and the top octaves most of it, which is why Seeing sound recommends a log axis when you look at one. Many models that listen (taggers, transcribers, beat trackers) bend the frequency axis first, so the picture spends its rows more the way your ear spends its attention. The usual bend is the mel scale: roughly even steps in hertz up to about 1,000 Hz, then roughly even steps in octaves above that. Each high octave gets about the same room as the one below it, even though it's twice as wide in hertz.
Hertz, bent toward hearing
Then the level gets the same treatment. Ears hear loudness by ratios too, so the strength in each band is taken as a logarithm, much like reading it in decibels. Quiet details stop vanishing next to loud ones. Put both together and you get the picture many listening models actually start from: a log-mel spectrogram. Instead of a thousand or more evenly spaced rows, it often has somewhere between a few dozen and a hundred or so bands.
That's another choice about what to throw away. Two high partials a few hundred hertz apart can end up in the same band and blur into one. That's usually fine for telling a snare from a clap, and a real loss if fine detail up high is what you care about. And phase is still gone, so a log-mel picture is even further from something you could play back exactly.
How small is a latent?
Here's a worked example with typical numbers. A model listening at 48,000 samples per second produces one latent frame every 512 samples, with eight numbers in each frame.
48,000 ÷ 512 is about 94 frames per second. Times eight numbers, that's 750 numbers a second, against 48,000 in one channel of the original. Roughly one number kept for every sixty-four.
The other sixty-three are gone. When the decoder turns those 750 numbers back into sound, it fills in the missing detail from what it learned during training. That's why a compact code can sound rich, and also why the result is the model's idea of your sound, not your sound. Train the decoder on birdsong and whatever you feed in comes back with a bird's accent. That's the trick behind neural instruments.
Why do clicks suffer most?
A latent frame is a snapshot of a short stretch of time. At one frame every 512 samples, that's a new snapshot about every 11 milliseconds. Some models use one every 2,048 samples, about every 43 milliseconds.
A click between snapshots
A held vowel barely changes between snapshots, so a sparse code describes it well. A click lives for a millisecond or two. Squeeze it into a frame tens of milliseconds wide and the decoder has to guess exactly when it happened and how sharp it was. Drum loops come back softened or flammed; pads come back almost untouched.
Spectrograms have their own version of this trade-off, and you can hear and see it on the loop below. A long analysis window sorts pitches finely but blurs when things happen; a short one pins down each hit and smears the pitches.
Switch between the two windows. Which one draws each drum hit as a thin vertical line, and which one separates the pitches of the kick and toms?
Sharp in time, or sharp in pitch?
ReplaySpectrogram window: 512 samples, 10.7 ms at 48 kHz; bins every 93.8 Hz. Shown up to 12 kHz.
There's no window that wins at both. Every picture a model uses has picked a side, and its mistakes come from that side.
Same idea, different place: a spectral freeze or a smeary time-stretch plugin hits exactly the missing-phase problem, met by an effect instead of a model. Spectral effects turns that flaw into a sound worth using.
Where rebuilding goes wrong
Each representation fails in its own recognisable way, and once you know them you can hear them:
- Rebuilt from a spectrogram: attacks go soft, and steady sounds pick up a phasey, swirling sheen. That's invented phase.
- Rebuilt from a sparse latent: sustained sounds come back convincingly; transients wander, soften or double.
- Rebuilt from tokens: each moment sounds plausible, but over several seconds the music can drift, as if it forgot where it was going.
None of these mean the model is bad. They mean the picture it worked from didn't keep that information, so it had to be guessed.
Make it yours
Pick two sounds you know well: one sharp (a clap, a rimshot, a picked note) and one sustained (a held vowel, a bowed note, a pad). For each, write one line answering four questions: what does the waveform make easy to see? What does a spectrogram show that the waveform hides? What would a sparse latent struggle to keep? What would a token model be most likely to get wrong over a longer phrase?
Then make your prediction: which of the two would suffer more from being squeezed into a compact code? Keep the sheet. When you next hear a generated or transformed sound, you'll be able to say which representation it went through by the way it fails. If you want to hear a decoder rebuilding sound while you play, neural instruments is where to go next.
Quick check
- You have only a spectrogram picture of a drum loop and you rebuild sound from it. Which part will sound most wrong, the kick's pitch or its punch? The punch. The picture keeps how strong each frequency is, so the pitch survives. The punch comes from all those frequencies lining up at one instant, which is phase, and the picture threw phase away.
- A model makes one frame every 2,048 samples at 48 kHz. Will a hi-hat pattern or a string pad come back closer to the original? The pad. Frames 43 ms apart describe a slowly changing sound well, but a hi-hat hit is over in a few milliseconds, so the decoder has to guess its timing and edge. Expect softened or slightly wandering hats.
- A generator writes music as tokens. Can you change the third token to fix a wrong note? No. Tokens are codes for short slices of sound, not notes. Changing one changes a sliver of audio texture, not a pitch you can name. To edit notes you need a note representation, like MIDI.
Next steps
- Go deeper: Audio generation. If a decoder can rebuild sound from a small code, could a model start from a code nobody ever recorded?
- Preparation: Seeing sound. Practise reading waveforms and spectrograms before you trust what a model draws.